Same flood, but r-io now receives the Vigicrues forecasts. At 18:00 they project the flood at 20:00, on all the forecast curves: only 2 hours left. The deduction checks the preventive closure against this deadline, refuses it (it would end at 20:47) and keeps the corrective procedure alone. At first its waits are still uncertain; the forecast of 15/11 00:00 projects when the Loire will drop below 4.0 m, and the waits, the To Do List and the expected duration of the plan narrow to precise values.
What this act demonstrates
The forecasts give r-io a projected future: when the flood may appear, how long it may last. The deduction uses it to refuse a preventive that would come too late and to deploy the corrective only. Each new forecast is then replayed: the waits, which had only their modelled interval (6 to 24 h), get a projected end, and every indicator built on them narrows.
01 · Step
Restart, reload, keep the forecasts on
Each act starts from a fresh r-io: restart the distribution and load the use case again. The actors booked by a previous act would otherwise stay booked on the same dates.
Restart r-io, then in r-ioga load Orleans Flood Crisis and open R-IOSEMIT and R-IOTA from Project List.
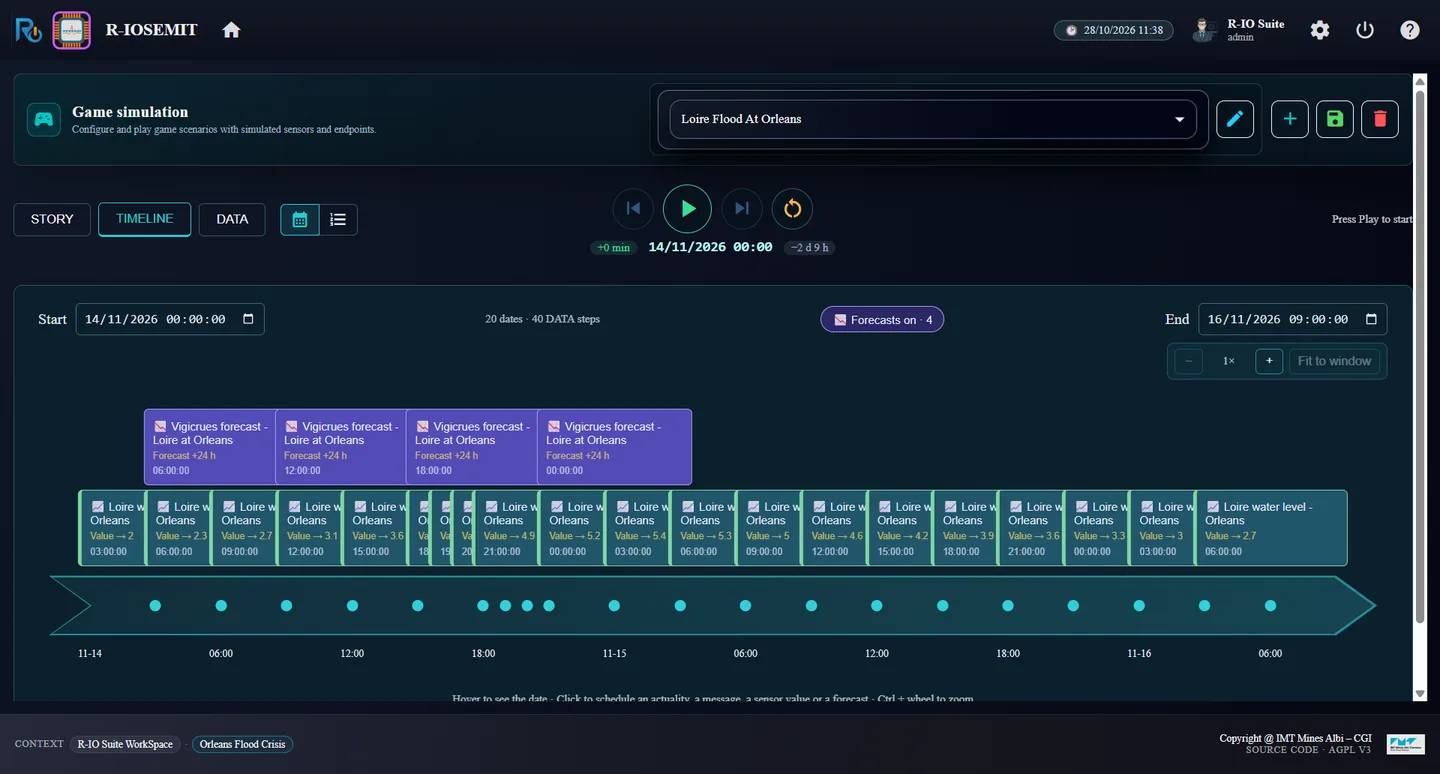
In r-iosemit, check that the button reads 📉 Forecasts on · 4 (no forecast muted).
Click ▶, Discrete, Start.
r-iosemit: “Forecasts on · 4”, the four Vigicrues forecasts will be played
ResultThe timeline shows 20 dates · 40 DATA steps and Forecasts on · 4, without “muted”.
02 · Step
Play until 18:00 and read the projection
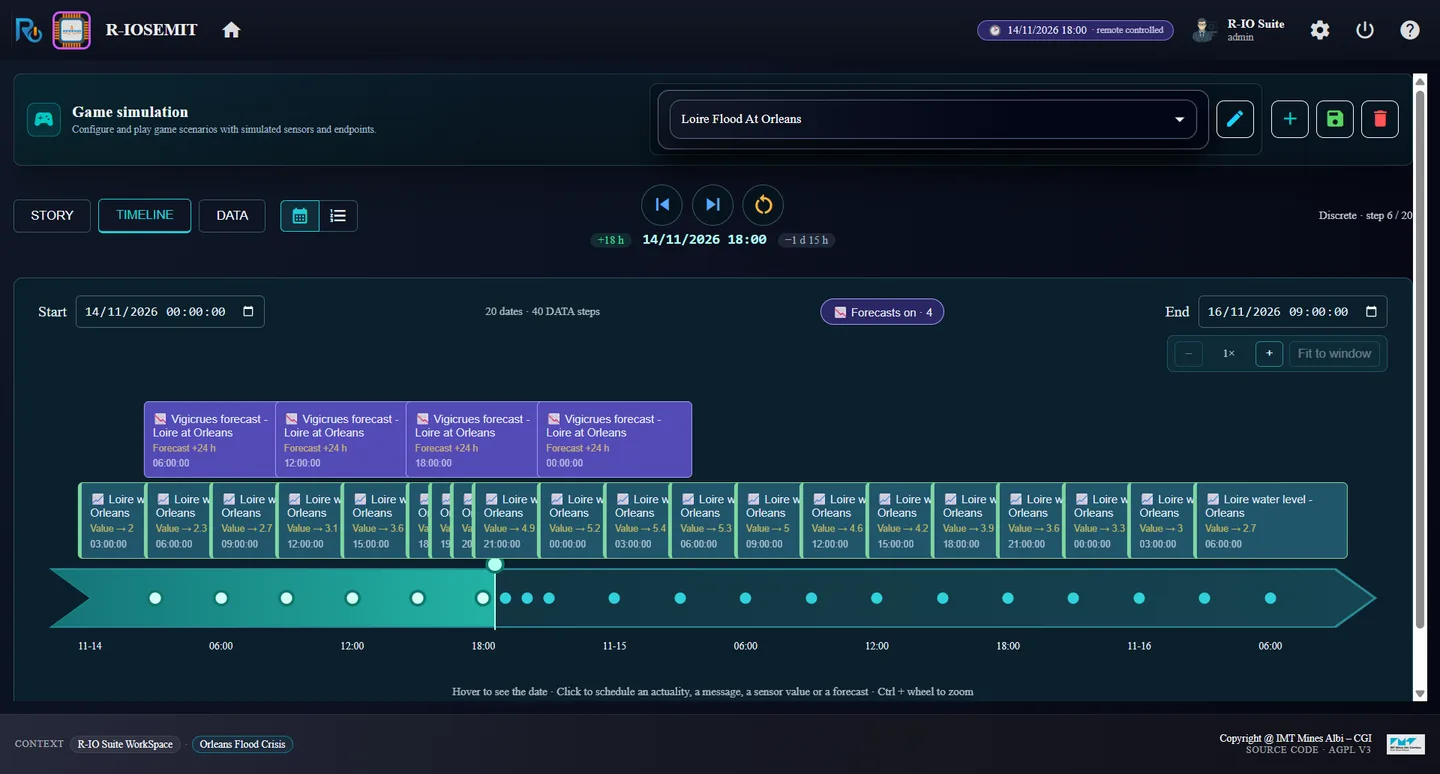
The forecasts of 06:00, 12:00 and 18:00 are replayed through the rules of the sensor over their 24 hours, curve by curve (an ensemble from low to high): r-io knows what may happen, without acting on it.
Click Next step until 14/11/2026 18:00 (step 6 / 20).
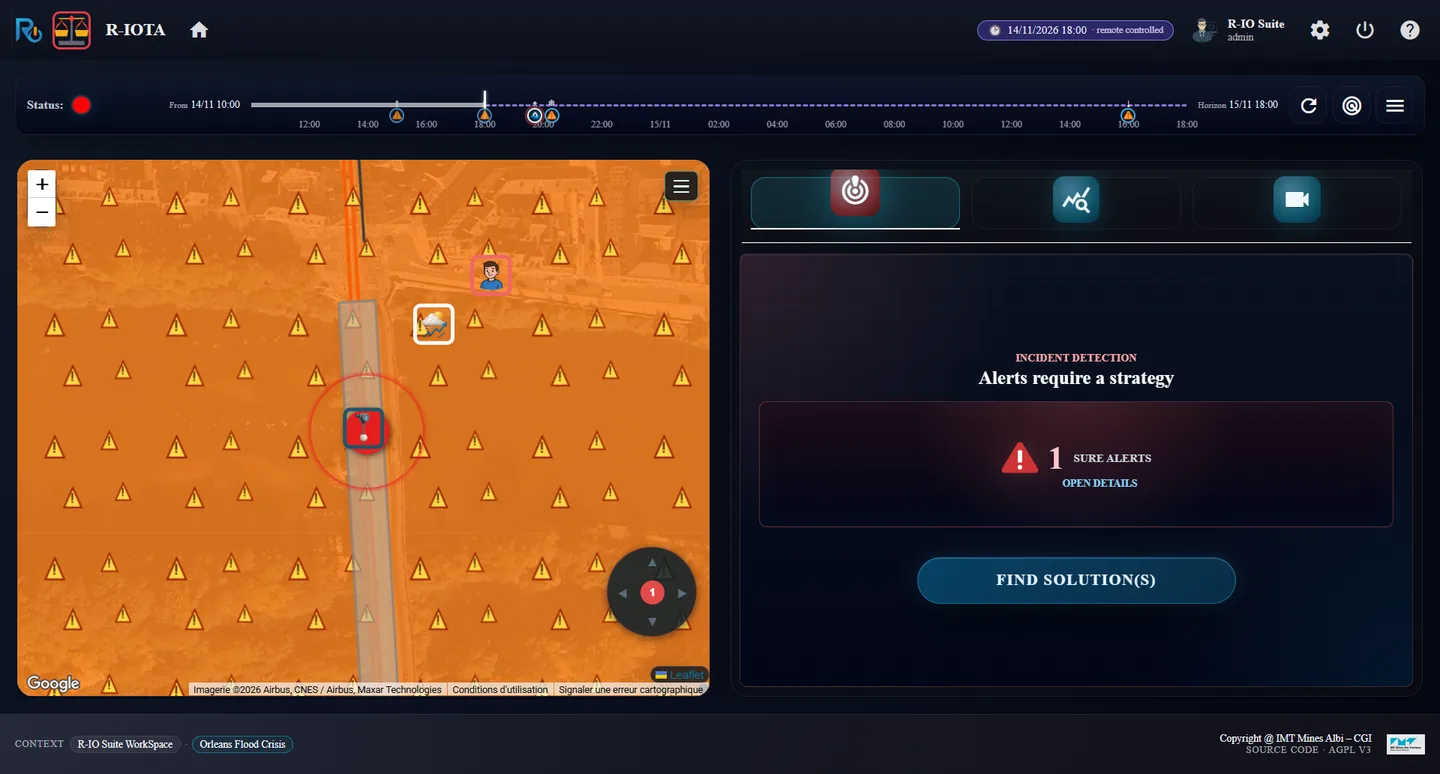
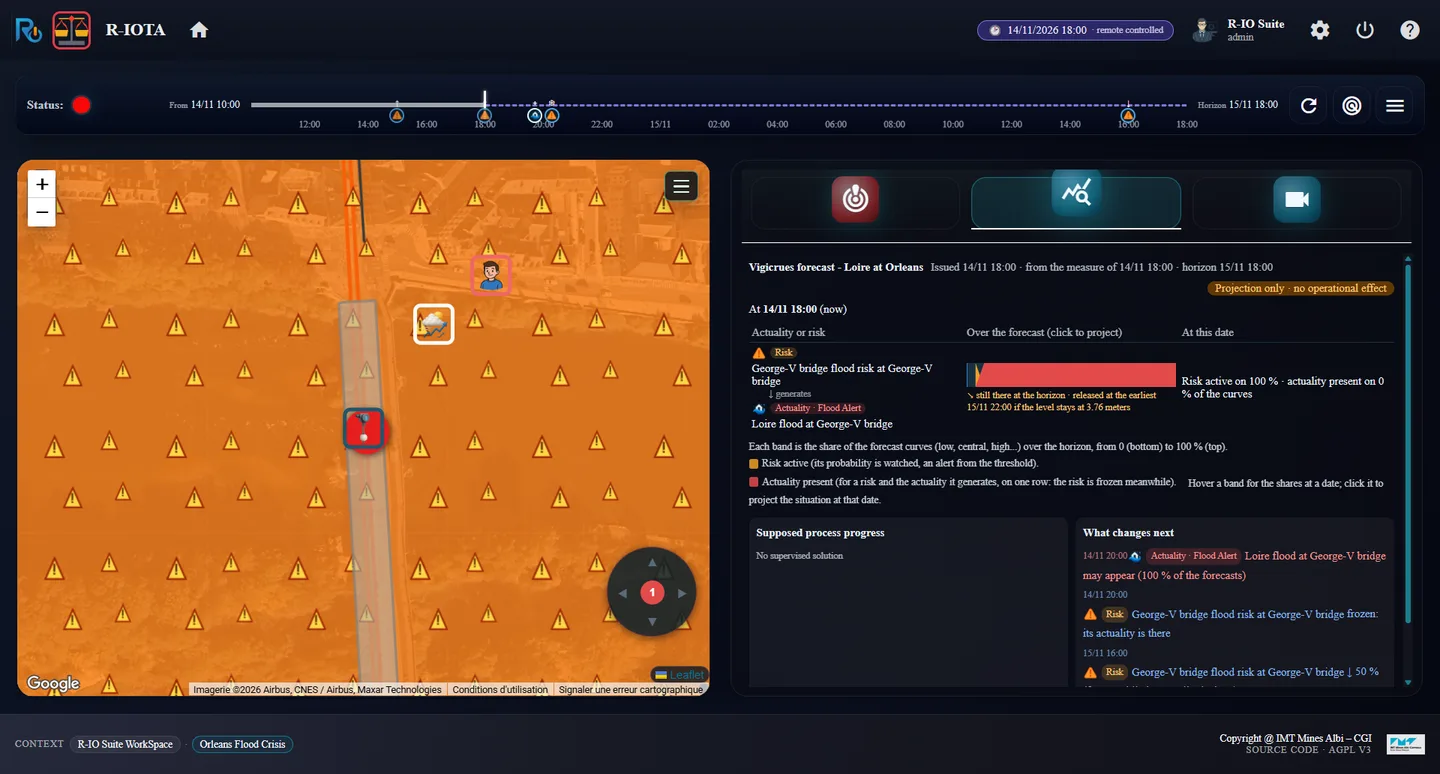
In r-iota, read the alert and the timeline, then open the Forecast tab.
r-iosemit at 18:00: the forecasts of 06:00, 12:00 and 18:00 playedr-iota: the supervision timeline goes on, dashed, to the horizon of the forecastForecast tab: the flood may appear at 20:00, released at the earliest 15/11 22:00
Result1 SURE ALERTS, and the supervision timeline now goes on, dashed, up to the horizon 15/11 18:00, with the projected moments as diamonds. The Forecast tab (Issued 14/11 18:00 · Projection only · no operational effect) shows the risk generating Loire flood at George-V bridge, which may appear at 14/11 20:00 (100 % of the forecasts), is still there at the horizon and is released at the earliest 15/11 22:00. r-iota also shows Foreseen by the forecasts · 14/11 20:00 · Loire flood at George-V bridge may appear.
03 · Step
Deduce with the forecasts: the preventive is refused
With the forecasts, the deduction checks each preventive against the projected appearance of the problem it prevents: its main task (here the closure of the bridge) must end before.
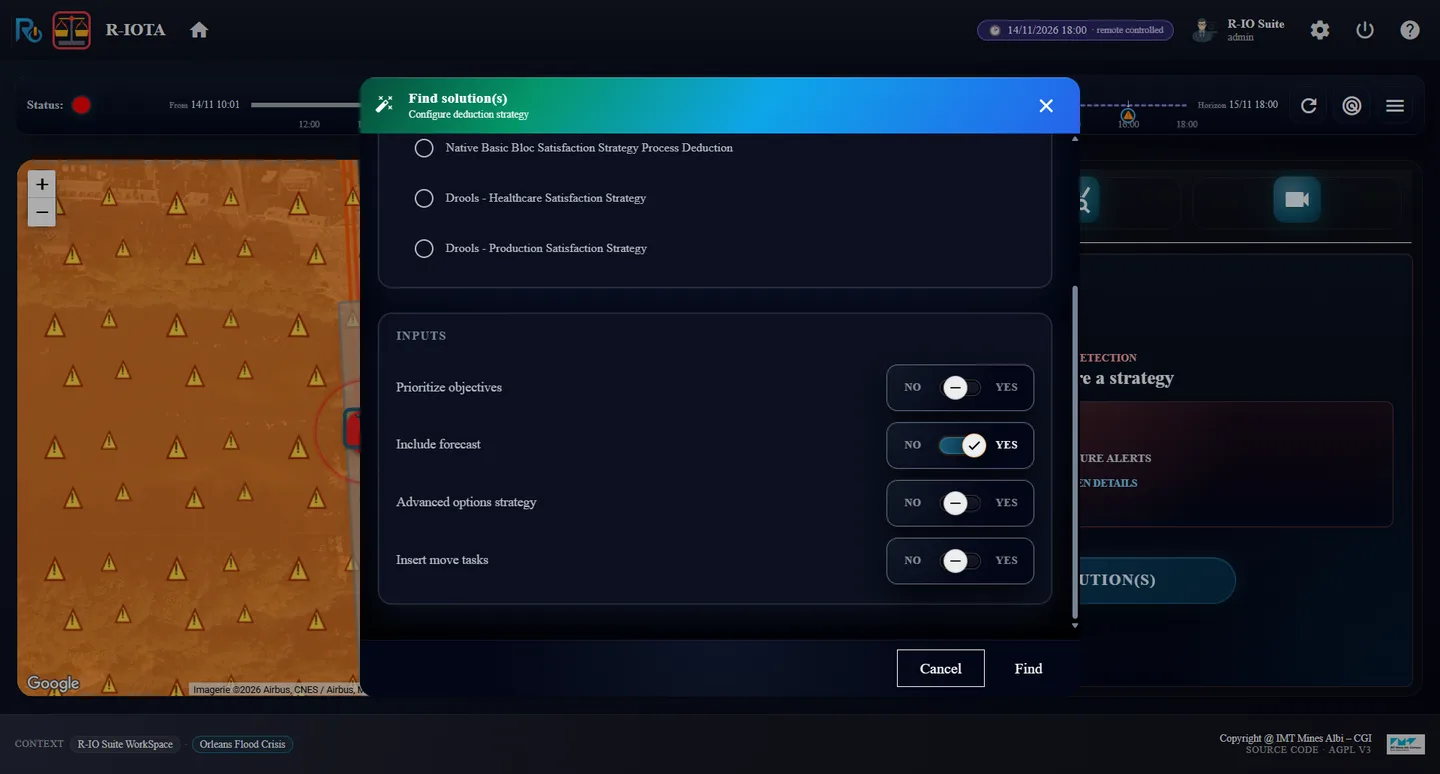
Click FIND SOLUTION(S): Include forecast is at YES because forecasts were received. Click Find (about 2 minutes).
Find solution(s): Include forecast at YES by default“The preventive procedure would end its main task at 14/11 20:47, after the projected appearance at 14/11 20:00. Only the corrective procedure is possible.”
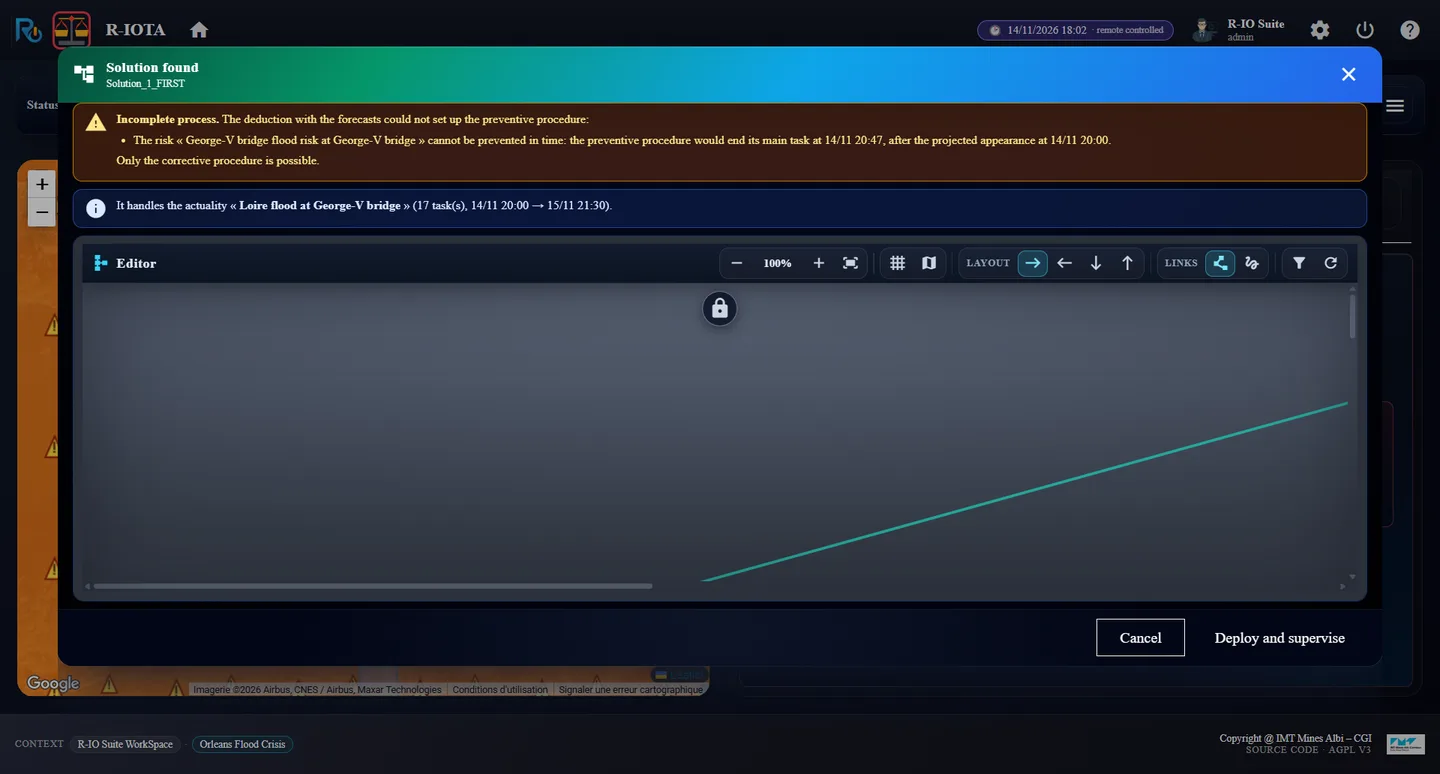
ResultIncomplete process. The deduction with the forecasts could not set up the preventive procedure: The risk « George-V bridge flood risk at George-V bridge » cannot be prevented in time: the preventive procedure would end its main task at 14/11 20:47, after the projected appearance at 14/11 20:00. Only the corrective procedure is possible. The solution keeps the corrective alone: 17 task(s), 14/11 20:00 → 15/11 21:30.
04 · Step
Deploy the corrective: the waits are still uncertain
The corrective is deployed alone. Its waits still keep their interval of 6 to 24 hours: the forecasts of 18:00 only reach 15/11 18:00 and do not see the Loire drop under 4.0 m for 6 hours.
Click Deploy and supervise.
In r-iosemit, tab TASKS, check AUTO.
Read the Expected vs field card of r-iota and the To Do List of r-ioga.
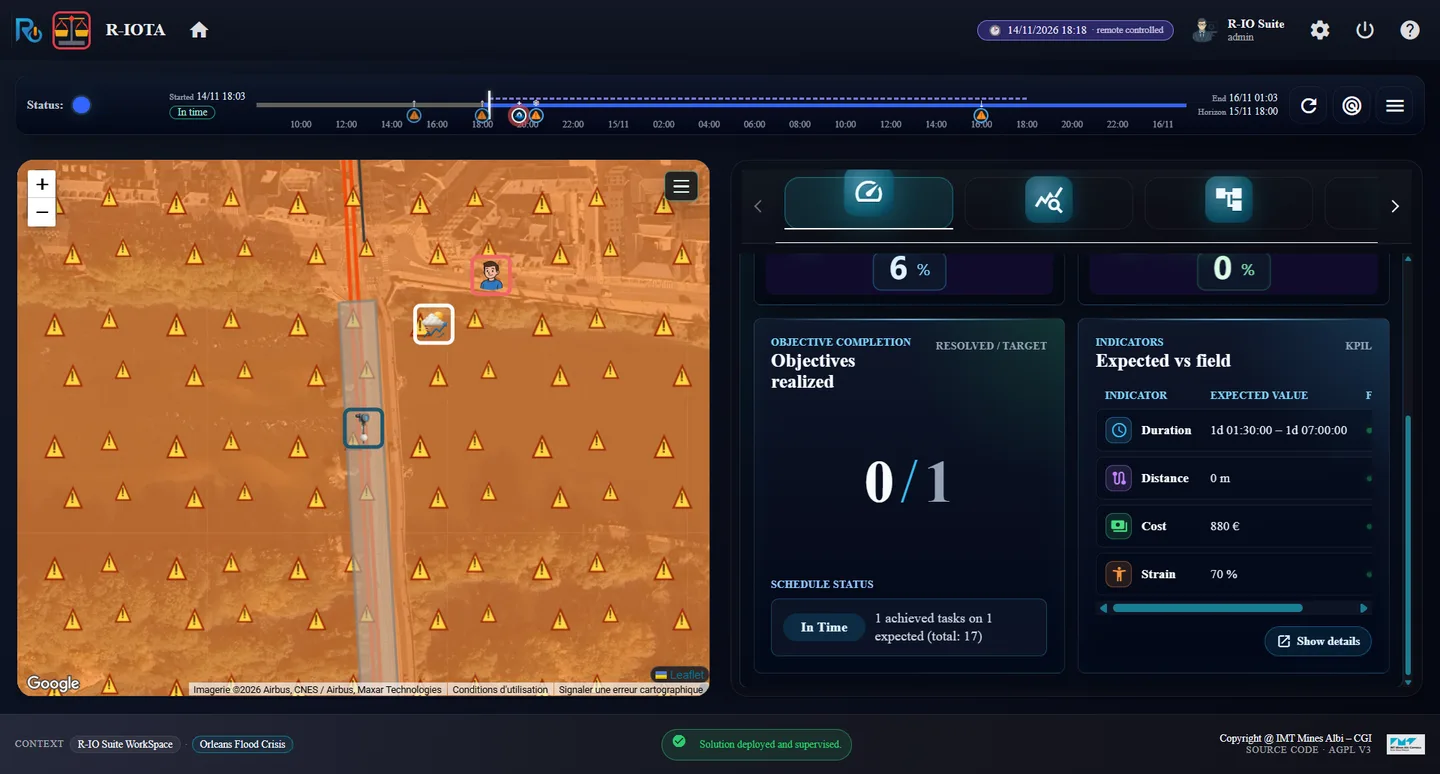
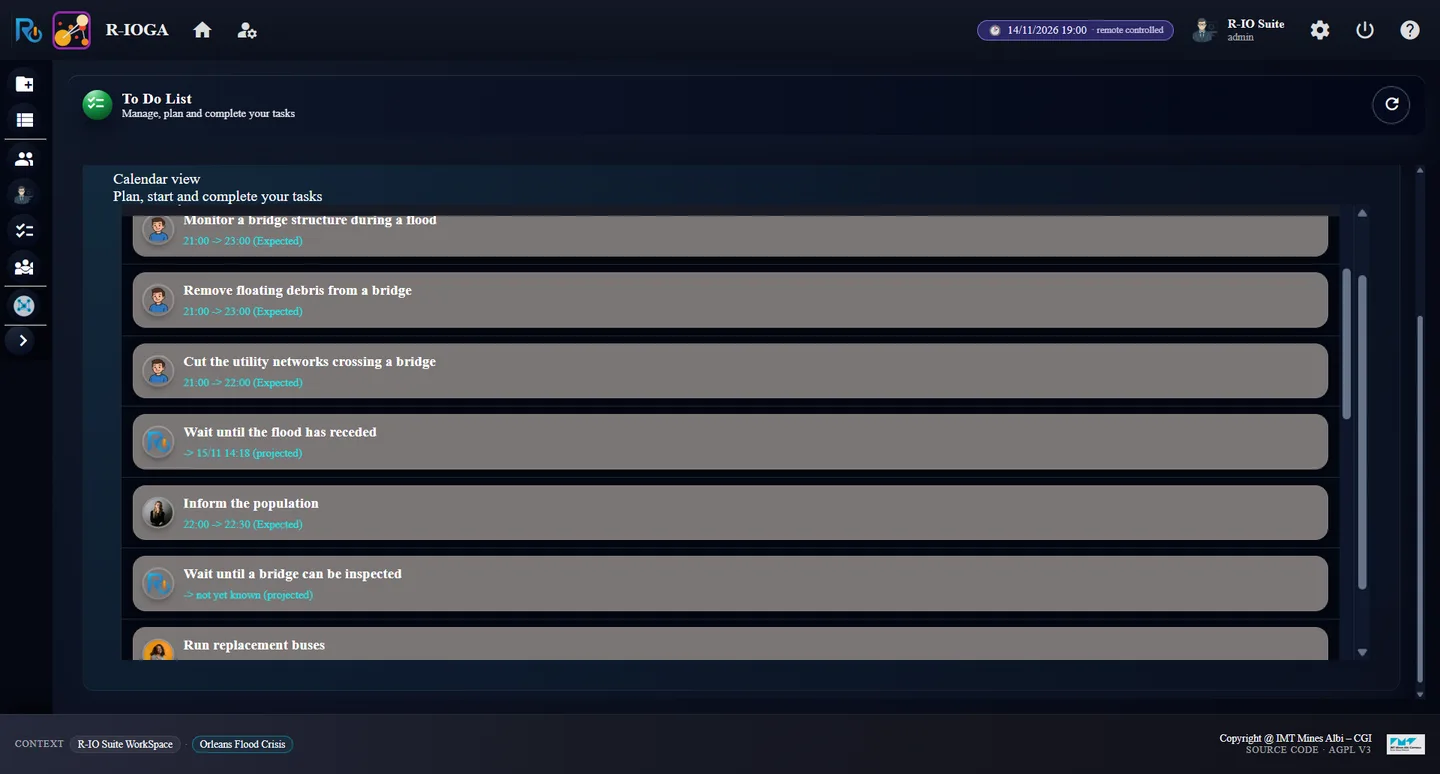
At deployment: Duration expected 1d 01:30 – 1d 07:00, an intervalTo Do List: the flood wait ends 15/11 14:18 (projected), the inspection wait “not yet known”
ResultSolution deployed and supervised., total: 17, 0 / 1. The expected duration is the interval 1d 01:30:00 – 1d 07:00:00 (cost 880 €, strain 70 %). The To Do List gives Wait until the flood has receded an end -> 15/11 14:18 (projected) and Wait until a bridge can be inspected-> not yet known (projected).
05 · Step
The forecast of midnight: everything narrows
The forecast of 15/11 00:00 reaches 16/11 00:00: it sees the Loire drop under 4.0 m and stay there. The release of the flood is projected, so is the end of each wait, and the plan after them.
In r-iosemit, tab TIMELINE, click Next step until 15/11/2026 00:00 (step 10 / 20).
Read r-iota, the To Do List, then click Wait until the flood has receded.
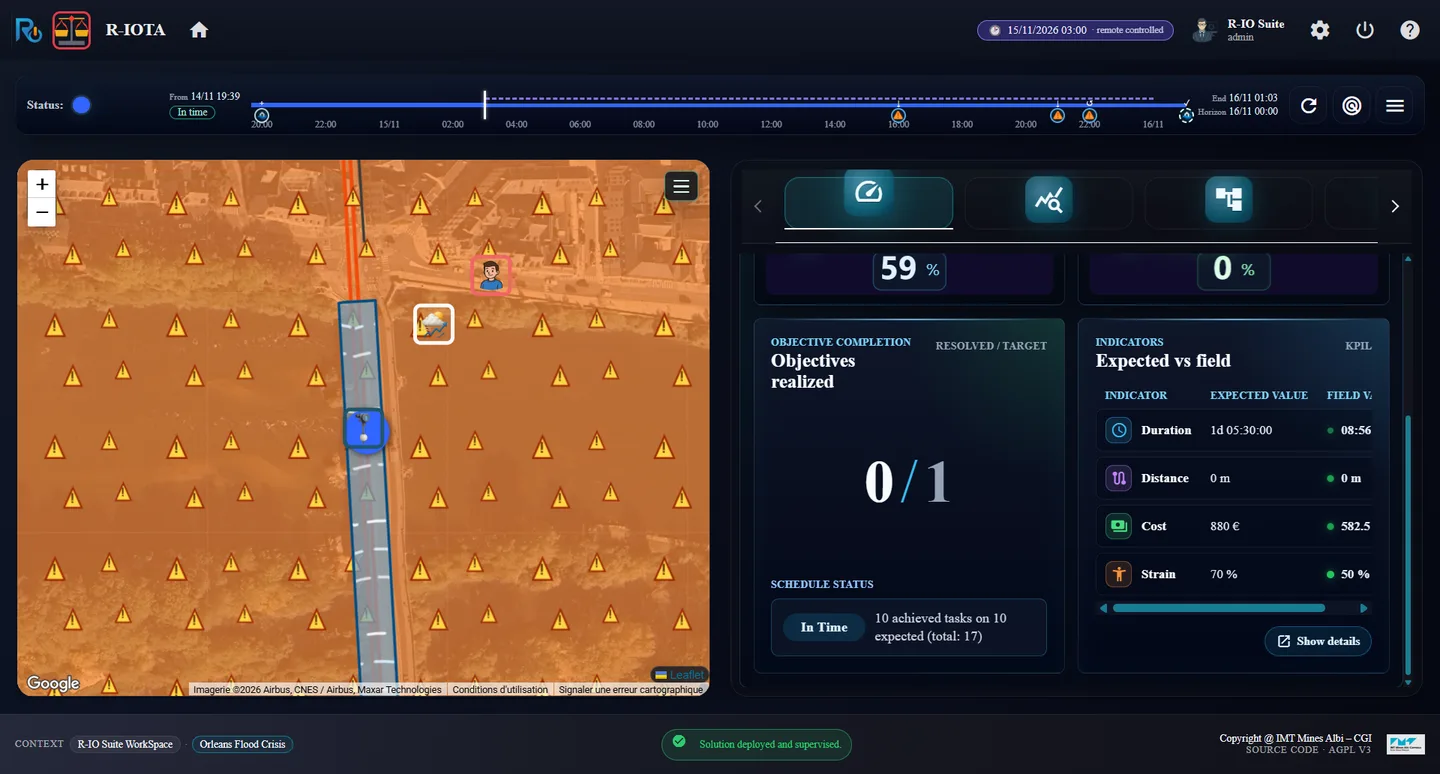
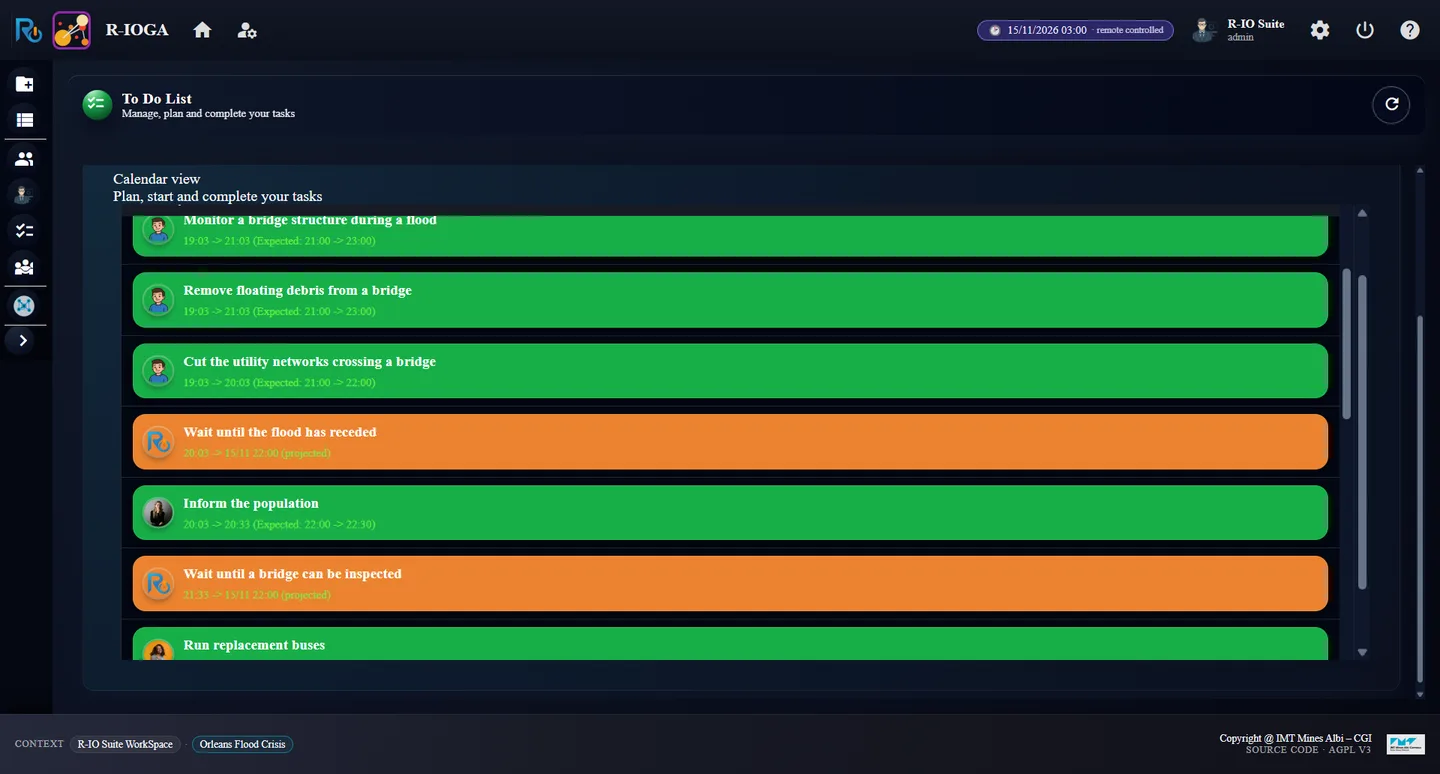
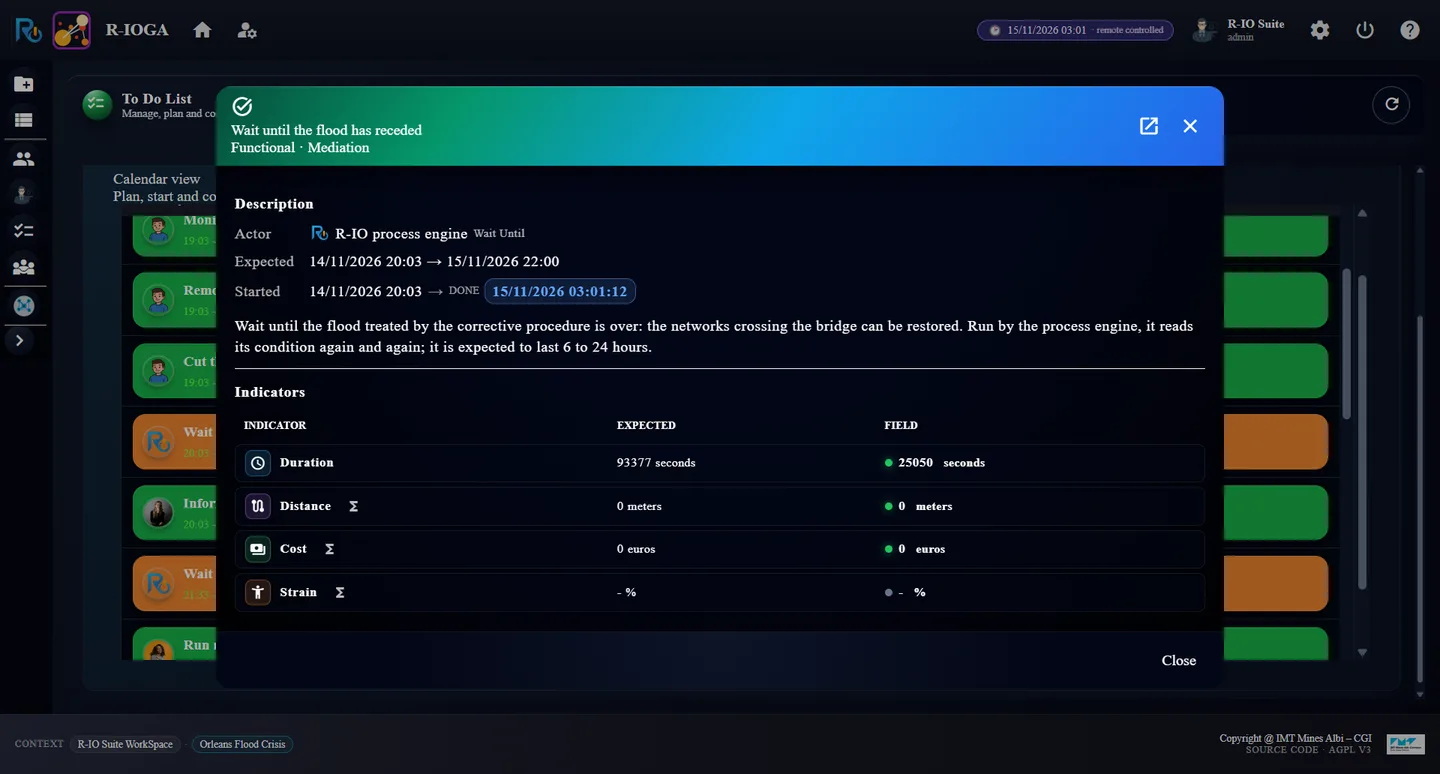
After the forecast of 00:00: Duration expected 1d 05:30:00, a precise valueTo Do List: both waits end 15/11 22:00 (projected)The wait: expected 14/11 20:03 → 15/11 22:00, 93377 seconds instead of 21600 – 86400
ResultThe expected duration of the plan goes from the interval 1d 01:30:00 – 1d 07:00:00 to a precise 1d 05:30:00. Both waits get the same projected end, -> 15/11 22:00 (projected), and the following tasks are planned after it. In the dialog of the wait, Expected 14/11/2026 20:03 → 15/11/2026 22:00 and the expected duration is 93377 seconds, where act 1 showed the interval 21600 – 86400 seconds.
06 · Step
Play until the end
The real release of the flood comes on 16/11 at 00:00 (6 hours under 4.0 m); the waits end then, and the inspection, the reopening and the announcement follow.
Click Next step until 16/11/2026 00:00 (step 18 / 20) and let the last tasks run.
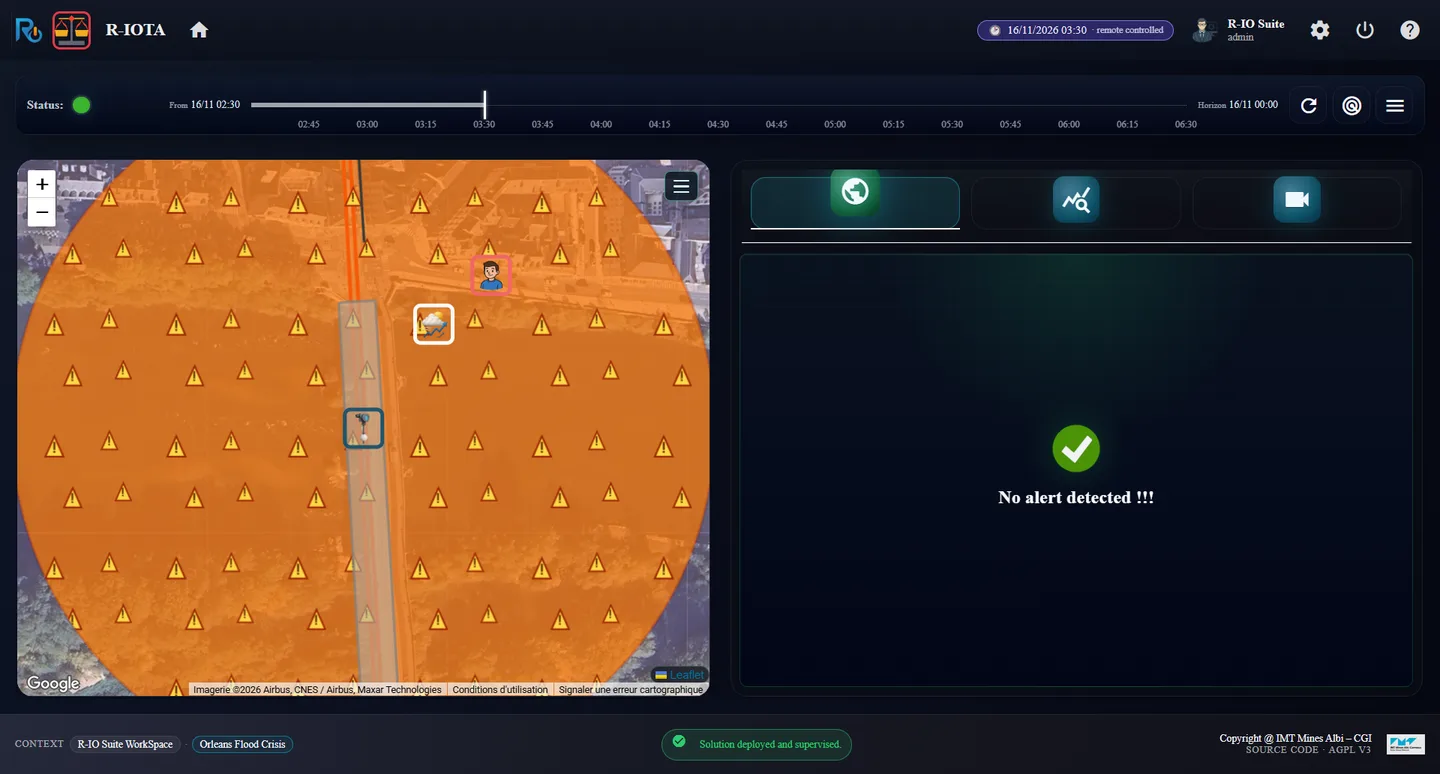
r-iota at 16/11 03:30: no alert, green status
ResultEnd at 16/11 03:30: r-iota shows 1 / 1, 17 achieved tasks on 17 expected (total: 17), No alert detected !!! and a green status.
Même crue, mais r-io reçoit cette fois les prévisions Vigicrues. À 18:00, elles projettent la crue à 20:00 sur toutes les courbes : il ne reste que 2 heures. La déduction confronte la fermeture préventive à cette échéance, la refuse (elle finirait à 20:47) et ne garde que la procédure corrective. Au départ, ses attentes restent incertaines ; la prévision du 15/11 00:00 projette le moment où la Loire repassera sous 4,0 m, et les attentes, la To Do List et la durée attendue du plan se resserrent sur des valeurs précises.
Ce que montre cet acte
Les prévisions donnent à r-io un futur projeté : quand la crue peut apparaître, combien de temps elle peut durer. La déduction s’en sert pour refuser un préventif qui arriverait trop tard et déployer le correctif seul. Chaque nouvelle prévision est ensuite rejouée : les attentes, qui n’avaient que leur intervalle modélisé (6 à 24 h), reçoivent une fin projetée, et tous les indicateurs qui en dépendent se resserrent.
01 · Étape
Redémarrer, recharger, garder les prévisions
Chaque acte part d’un r-io neuf : redémarrer la distribution et recharger le cas d’usage. Sinon, les acteurs réservés par l’acte précédent le restent sur les mêmes dates.
Redémarrer r-io, puis dans r-ioga charger Orleans Flood Crisis et ouvrir R-IOSEMIT et R-IOTA depuis Project List.
Dans r-iosemit, vérifier que le bouton affiche 📉 Forecasts on · 4 (aucune prévision en sourdine).
Cliquer ▶, Discrete, Start.
r-iosemit : « Forecasts on · 4 », les quatre prévisions Vigicrues seront jouées
RésultatLa frise affiche 20 dates · 40 DATA steps et Forecasts on · 4, sans « muted ».
02 · Étape
Jouer jusqu’à 18:00 et lire la projection
Les prévisions de 06:00, 12:00 et 18:00 sont rejouées dans les règles du capteur sur leurs 24 heures, courbe par courbe (un ensemble de la plus basse à la plus haute) : r-io sait ce qui peut arriver, sans agir dessus.
Cliquer Next step jusqu’à 14/11/2026 18:00 (étape 6 / 20).
Dans r-iota, lire l’alerte et la réglette, puis ouvrir l’onglet Forecast.
r-iosemit à 18:00 : les prévisions de 06:00, 12:00 et 18:00 jouéesr-iota : la réglette de supervision se prolonge en pointillés jusqu’à l’horizon de la prévisionOnglet Forecast : la crue peut apparaître à 20:00, levée au plus tôt le 15/11 22:00
Résultat1 SURE ALERTS, et la réglette de supervision se prolonge désormais en pointillés jusqu’à l’horizon 15/11 18:00, les moments projetés en losanges. L’onglet Forecast (Issued 14/11 18:00 · Projection only · no operational effect) montre le risque qui génère Loire flood at George-V bridge, qui peut apparaître le 14/11 à 20:00 (100 % des prévisions), est encore là à l’horizon et est levée au plus tôt le 15/11 à 22:00. r-iota affiche aussi Foreseen by the forecasts · 14/11 20:00 · Loire flood at George-V bridge may appear.
03 · Étape
Déduire avec les prévisions : le préventif est refusé
Avec les prévisions, la déduction confronte chaque préventif à l’apparition projetée du problème qu’il prévient : sa tâche principale (ici la fermeture du pont) doit finir avant.
Cliquer FIND SOLUTION(S) : Include forecast est à YES car des prévisions ont été reçues. Cliquer Find (environ 2 minutes).
Find solution(s) : Include forecast à YES par défaut« The preventive procedure would end its main task at 14/11 20:47, after the projected appearance at 14/11 20:00. Only the corrective procedure is possible. »
RésultatIncomplete process. The deduction with the forecasts could not set up the preventive procedure: The risk « George-V bridge flood risk at George-V bridge » cannot be prevented in time: the preventive procedure would end its main task at 14/11 20:47, after the projected appearance at 14/11 20:00. Only the corrective procedure is possible. La solution ne garde que le correctif : 17 task(s), 14/11 20:00 → 15/11 21:30.
04 · Étape
Déployer le correctif : les attentes restent incertaines
Le correctif est déployé seul. Ses attentes gardent encore leur intervalle de 6 à 24 heures : les prévisions de 18:00 ne vont que jusqu’au 15/11 18:00 et ne voient pas la Loire rester 6 heures sous 4,0 m.
Cliquer Deploy and supervise.
Dans r-iosemit, onglet TASKS, cocher AUTO.
Lire la carte Expected vs field de r-iota et la To Do List de r-ioga.
Au déploiement : durée attendue 1 j 01:30 – 1 j 07:00, un intervalleTo Do List : l’attente de la décrue finit le 15/11 14:18 (projeté), celle de l’inspection « not yet known »
RésultatSolution deployed and supervised., total: 17, 0 / 1. La durée attendue est l’intervalle 1d 01:30:00 – 1d 07:00:00 (coût 880 €, pénibilité 70 %). La To Do List donne à Wait until the flood has receded une fin -> 15/11 14:18 (projected) et à Wait until a bridge can be inspected-> not yet known (projected).
05 · Étape
La prévision de minuit : tout se resserre
La prévision du 15/11 00:00 va jusqu’au 16/11 00:00 : elle voit la Loire repasser sous 4,0 m et y rester. La levée de la crue est projetée, donc la fin de chaque attente, et le plan qui suit.
Dans r-iosemit, onglet TIMELINE, cliquer Next step jusqu’à 15/11/2026 00:00 (étape 10 / 20).
Lire r-iota, la To Do List, puis cliquer Wait until the flood has receded.
Après la prévision de 00:00 : durée attendue 1 j 05:30:00, une valeur préciseTo Do List : les deux attentes finissent le 15/11 22:00 (projeté)L’attente : attendue 14/11 20:03 → 15/11 22:00, 93377 secondes au lieu de 21600 – 86400
RésultatLa durée attendue du plan passe de l’intervalle 1d 01:30:00 – 1d 07:00:00 à une valeur précise de 1d 05:30:00. Les deux attentes reçoivent la même fin projetée, -> 15/11 22:00 (projected), et les tâches suivantes sont planifiées après. Dans la boîte de l’attente, Expected 14/11/2026 20:03 → 15/11/2026 22:00 et la durée attendue est de 93377 secondes, là où l’acte 1 montrait l’intervalle 21600 – 86400 secondes.
06 · Étape
Jouer jusqu’à la fin
La levée réelle de la crue arrive le 16/11 à 00:00 (6 heures sous 4,0 m) ; les attentes finissent alors, puis viennent l’inspection, la réouverture et l’annonce.
Cliquer Next step jusqu’à 16/11/2026 00:00 (étape 18 / 20) et laisser se dérouler les dernières tâches.
r-iota le 16/11 à 03:30 : aucune alerte, statut vert
RésultatFin le 16/11 à 03:30 : r-iota affiche 1 / 1, 17 achieved tasks on 17 expected (total: 17), No alert detected !!! et un statut vert.